From environmental queries to live collaboration
The municipality of Winterswijk, in the beautiful Achterhoek region of the Netherlands, already uses a platform powered by Graphileon for some demanding work. They use it to answer questions about which environmental policies apply to specific locations, to analyse and model traffic flows, and to query thousands of publicly available map layers. It is exactly the kind of layered, interconnected problem that graphs are good at.
Their latest assignment to us was to take that further: extend the platform so that users can easily create their own map layers and share updates in real time. In this post — and the accompanying video — I walk through the basic functionality of the collaborative maps application we configured for them.
Many users, many locations, one map
The starting point is collaboration. In the demo in the video below I run two browser windows side by side, each logged in as a different user. Both sessions happen to be on the same computer, but that is only for convenience: the setup supports any number of sessions, at any number of locations around the globe. Two people in the same office or two hundred people across several countries — the mechanism is the same.
Loading from ~6,000 public layers
A user can load map layers from a list of about 6,000 publicly available layers that intersect with the municipality of Winterswijk. Once a layer is loaded, its legend appears and the layers can be re-ordered to control what sits on top of what. Some layers are read-only — for those, the corresponding icons are simply disabled, so it is always clear what you are and are not allowed to do.
Creating your own layer
The more interesting part is creating your own layer. Imagine you are organising a festival in the summer and want a map layer that records which activities take place where. The locations here are areas, so you need to draw polygons directly on the map. The new layer is added to the list of active layers as soon as you create it.
From there you can:
- Add fields that hold information about each area — for example, the type of activity.
- Define the options a user can choose from for each field, so the data stays clean and consistent.
- Generate styling from a dedicated styling tab, based on the values of a field, so the map visually reflects the underlying data.
Permissions: co-own, edit, or view
The creator of the layer gets to decide who else gets access. He/she can select the teams that are permitted to co-own, edit, or view the layer. In the demo I assign a team of viewers, so I can share my updates with users at the other location without giving them edit rights. Permissions are not an afterthought bolted onto the map — they are part of how the application is configured.
Real-time editing and streaming
This is where it becomes genuinely collaborative. When the other user loads the layer, he has no editing permissions. The moment I start editing, he is notified that I have locked the layer for editing — so there is no confusion about who is changing what. And when I activate streaming, my updates are pushed straight to his map as I make them.
To show it in action, I draw an area in a green space not far from the city centre and mark it as a space for sports. Next to it I place a second area for a temporary food court. Both appear, live, on the other user’s screen.
Collaboration goes both ways
The other user has a job of his own: he is responsible for the temporary tap water points. He creates a separate layer for those water points, sets the permissions so that I can see it, and activates streaming. Now the water points appear on my screen as he places them. Two people, two layers, one shared and continuously updated picture of the festival site. The streaming is powered by the Graphileon Websocket function, for which different types of messages are defined, each one having its own payload. 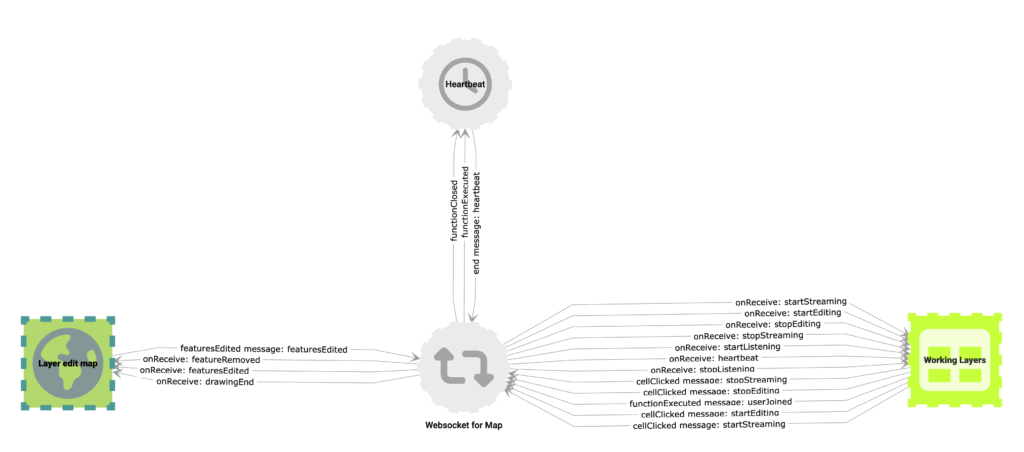
Why we build it this way
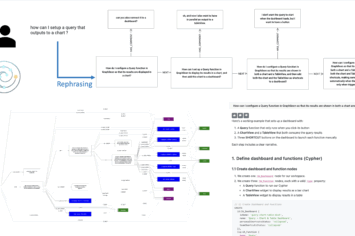
This is how our collaborative maps application works. What makes it powerful is what sits underneath. Both the application logic and the user interface are configured using Graphileon, our low-code platform, and stored in a graph database. That is what keeps the application flow highly extensible and adaptable — adding a new field type, a new permission model, or a new behaviour is a matter of configuration, not a rebuild. And thanks to its powerful API, it communicates and integrates well with existing IT infrastructure.
Winterswijk started with environmental policy questions, traffic modelling, and thousands of map layers. Collaborative, real-time map creation is simply the next layer on the same foundation — which is exactly the point.
Interested?
If you would like to know more about the collaborative maps application, or about what Graphileon could do for your organisation, please reach out to tomzeppenfeldt@graphileon.com or collaborative_maps@graphileon.com.

 Cloud
Cloud