Various ministries in the Kingdom of Jordan are responsible for the delivery of projects that contribute to the country’s economic and social development. Ideally, these projects are aligned to reinforce each other : benefits from one project create the conditions for the success of the next.
Intertwined project logic
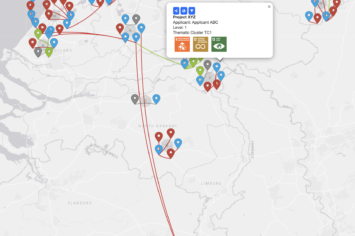
The fact that the intervention logic of projects is intertwined, makes the strategic alignment of projects a “graphy” use case. In the case of Jordan, hundreds of projects are implemented simultaneously. When it comes to keeping track which project activities eventually contribute to which social-economic impact, which target-population benefits (in-)directly from activities funded by a specific donor, graph-based planning monitoring and reporting allows to provide the relevant information rapidly. Graph-based planning monitoring and reporting
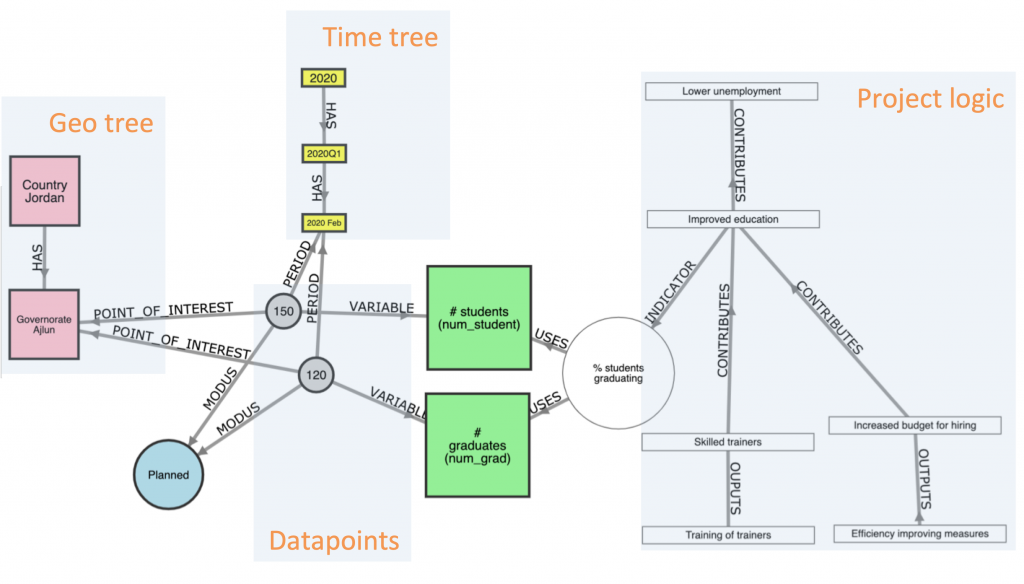
In order to monitor the delivery of projects, a set of indicators has been defined. They are linked to various stages in the project logic (e.g. some to an activity, others to a specific outcome or impact). Indicators have values that correspond to planned, projected, estimated or actual levels of achievement. Periodical collection of data, in the context of monitoring, allows calculating the indicator levels and predefined intervals, which provides an input to the evaluation and possible adaptation of the focus of projects.
Geo-administrative tree and time tree
The administrative hierarchy of the country, i.e. the way it is divided into regions and governorates, and governorates into districts, in which there are cities, is a graph. The same applies to the concept of time: an era has years, a year has quarters, a quarter has months.
By applying a graph model instead of a relational model, it becomes a lot easier to store, manage and query these hierarchies, even when the hierarchy is not entirely regular or symmetrical. This has a huge and positive impact on the performance during reporting, especially when aggregation (rolling up to a higher level) of data is required.
The atoms: datapoints
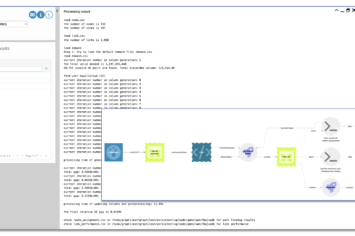
Collection of field data and the assurance of data-quality is expensive. It is therefore essential to optimize data collection. This means basically two things: do not collect data that is not used to calculate any of the indicators and try to re-use data whenever you can.
The first is achieved by storing the relationships between each indicator and the variables that are needed for its calculations, the second by storing individual data points, in the form of hyper-graphs that can be aggregated, and sliced in many different ways.
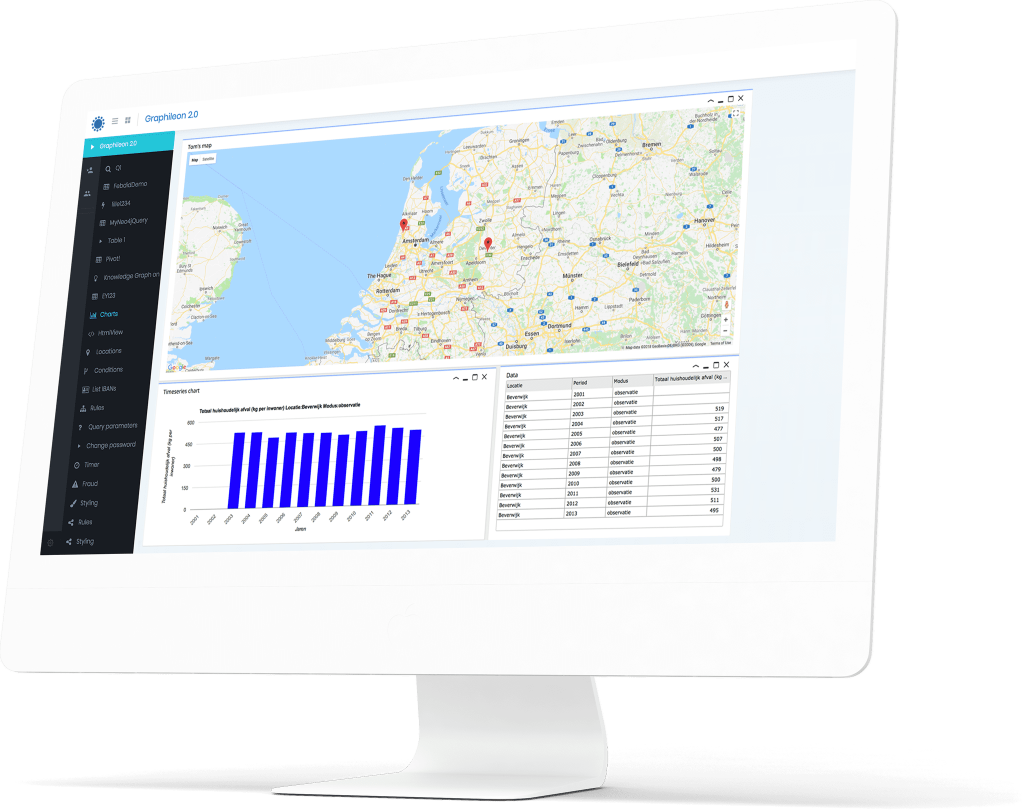
Powered by Graphileon
Wit our graph-based planning monitoring and reporting, we are proud to contribute to the success of the EU-funded M&ETAJo2025 project by providing a flexible Management Information System based on Graphileon application logic. We are convinced that it will help the government of Jordan to closely monitor the delivery of key projects to its population.