In food processing and packaging, it is essential that stock levels of fresh ingredients are sufficient, food processing machines are operational and the staff to operate them are available. This is the field in which one of our customers, The Power Central, has been operating since 2020. Besides its own food packaging activities, The Power Central also supports organisations by providing simple, yet powerful information systems to replace the commonly used spreadsheets and isolated bookkeeping systems.
Over the last couple of months, The Power Central has incorporated graph technology into its offering to customers. The reason is pretty obvious: in food production, you have to deal with ingredients and suppliers, with machines to process ingredients and package them into finished products. Customer orders typically have multiple order lines, and although in most cases they will order finished products, they also may order sub-products or even raw ingredients. In a post on LinkedIn, Vish Puttagunta explains the benefits and the added value Graphileon brings compared to a solution purely based on Microsoft Power BI.
Bill of Materials and InventoryA partial view of how these elements are connected is visualized in this picture. The finished product (on the left) requires a certain amount of raw ingredients, and sub-products and resources like persons and machines (in green). Certain of the ingredients and sub-products that will be ordered are in stock (i.e. the inventory is greater than zero), while others have to be produced or procured in case customers place an order for products that they are part of. |
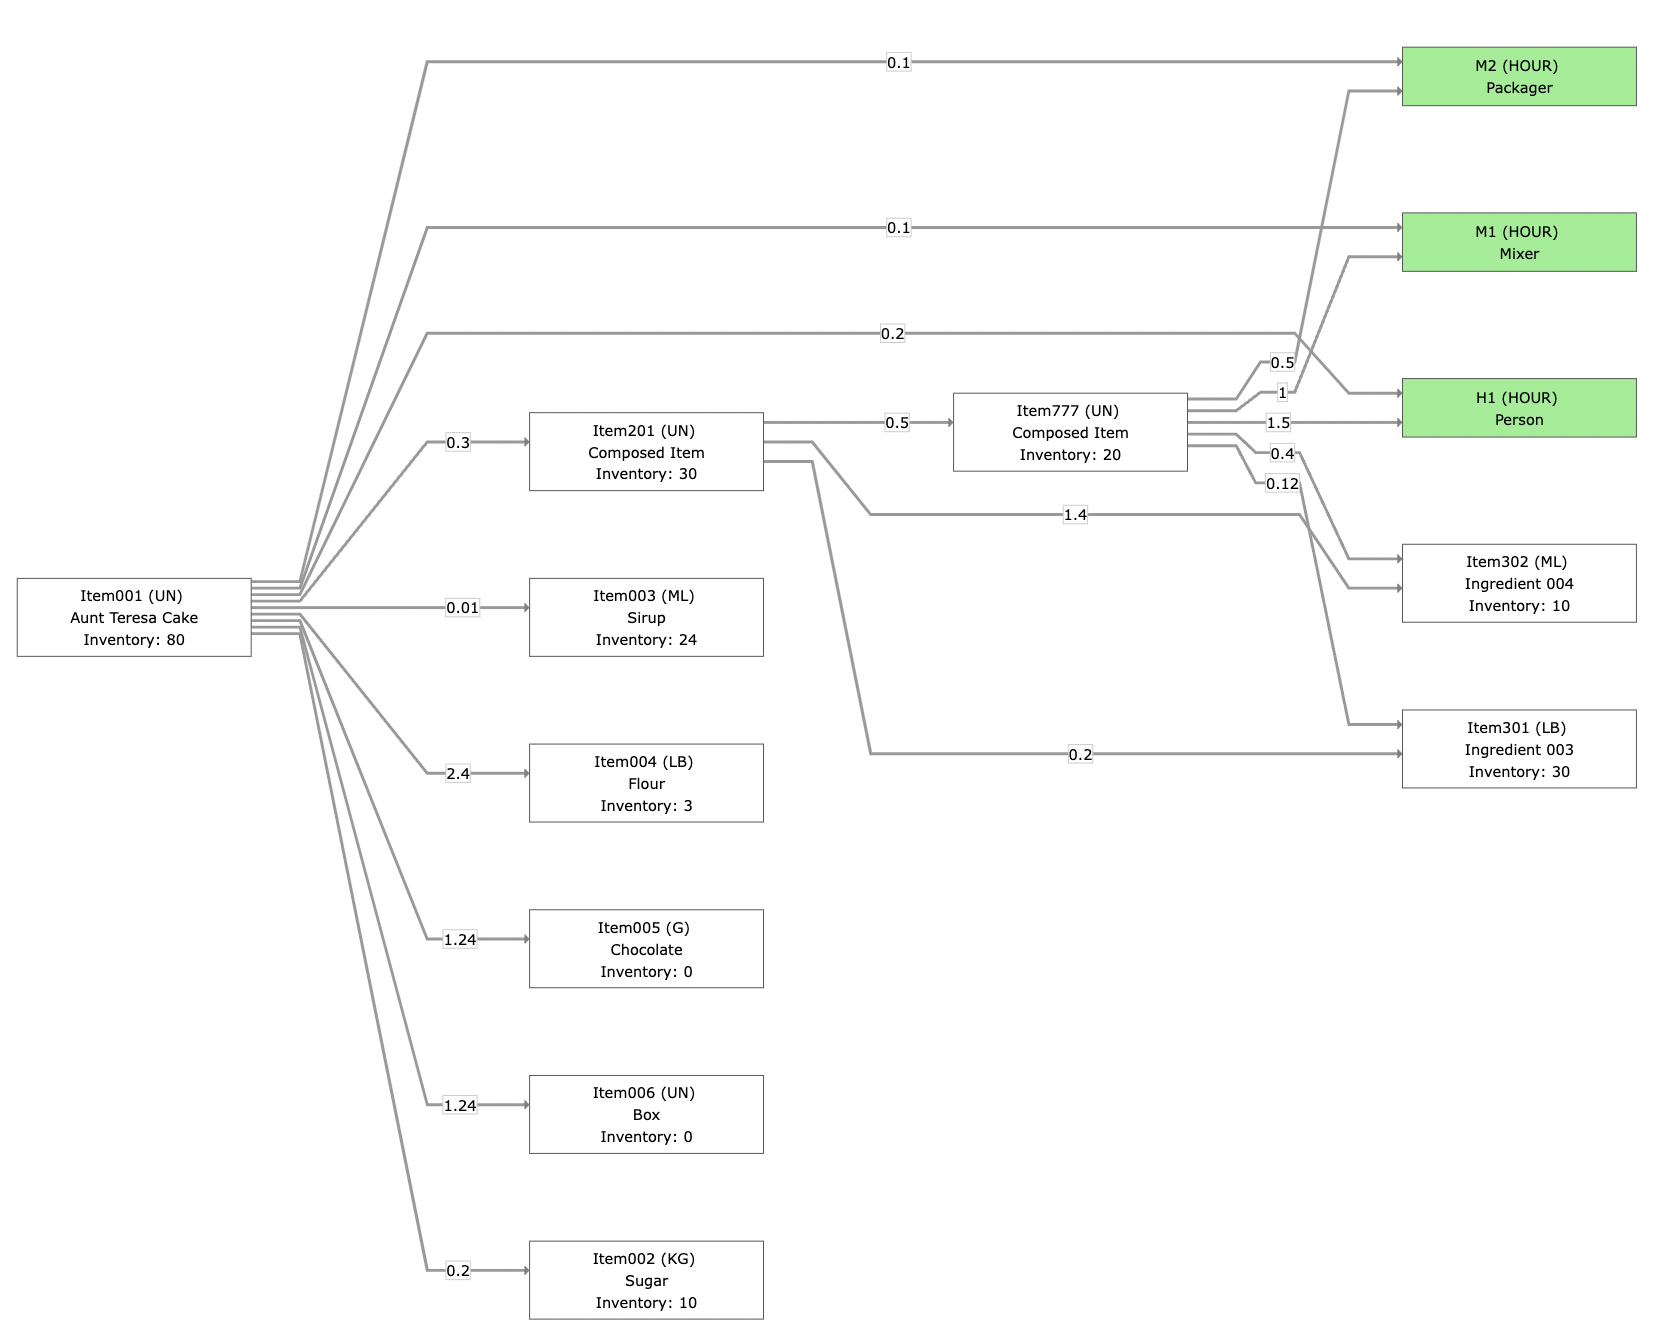 |
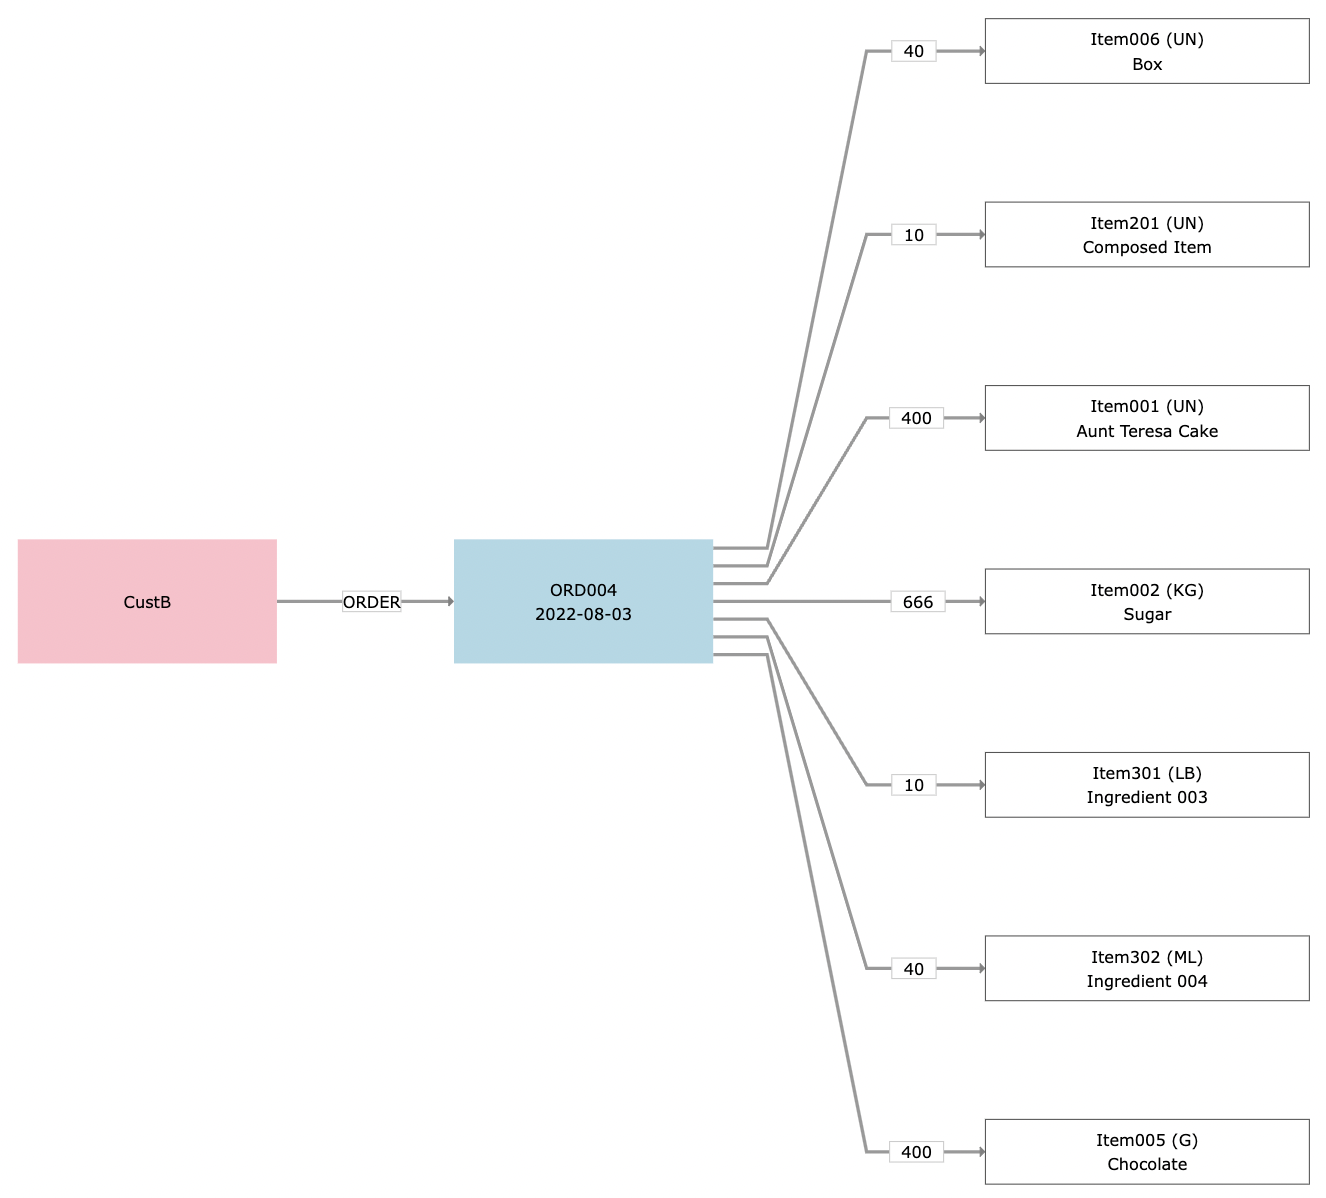
OrdersEach order is linked to a customer and a number of order lines, as is shown in the next picture. The quantities ordered for each item are indicated on the relationship between the order and order line. Note that a customer can order from any level of the Bill of Materials: finished products, but also sub-products or raw ingredients.
|
 |
Order fulfilment
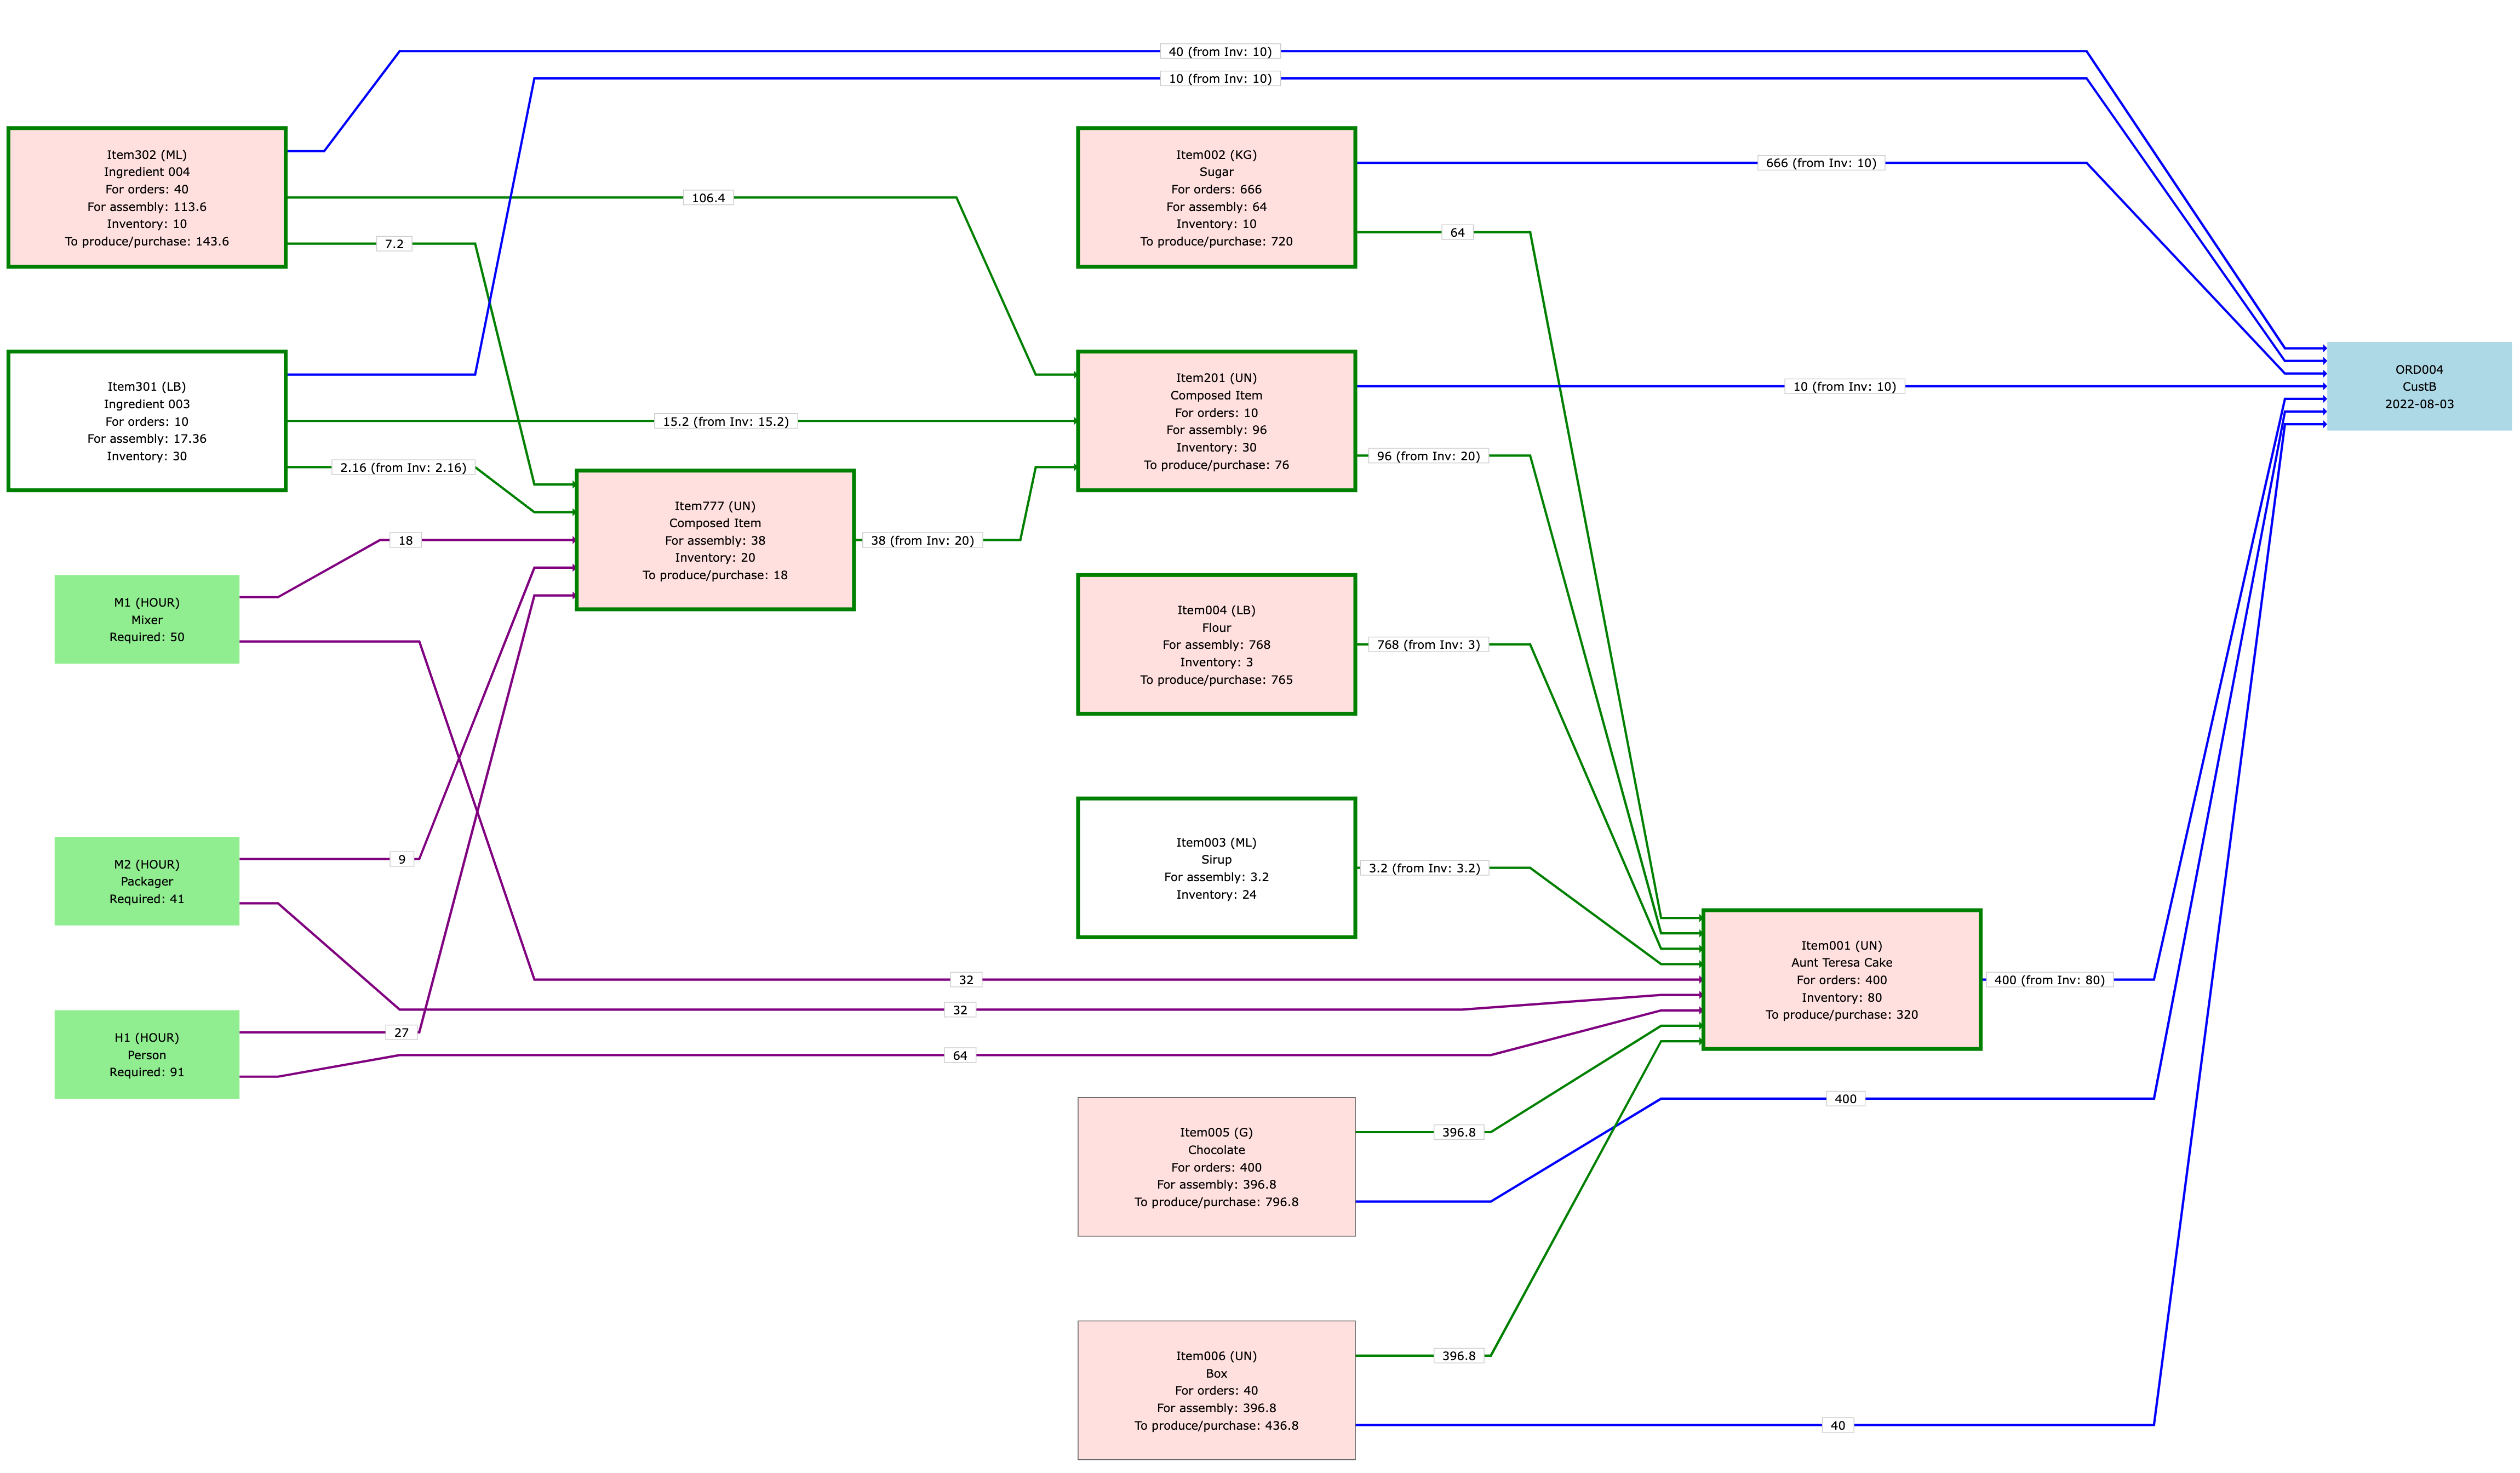
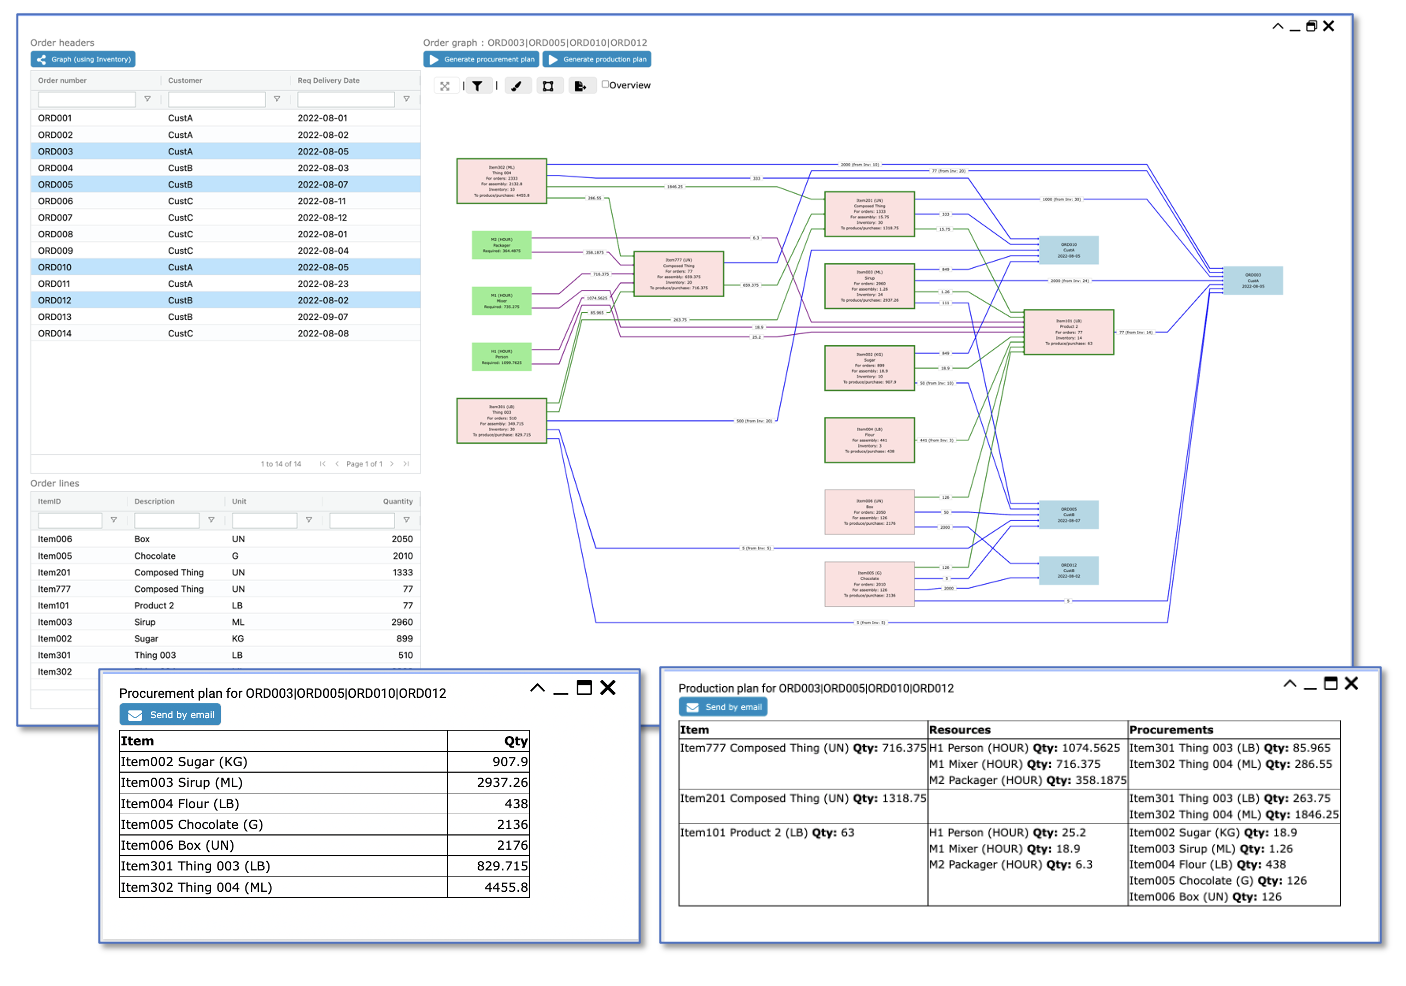
For the company that receives the order, the challenge is to fulfil the order while optimally using the inventory and to plan any procurement and assembly of the necessary items and sub-products in the right order. To do this, we use the knowledge about the inter-dependency of finished products, sub-products and raw ingredients that can be derived from the bill of materials,
The resulting graph visualization shows a lot of information about the fulfilment of the order, including
- The requirements in terms of machines and staff, which are green.
- The items (finished goods / sub-products / raw materials) are in pink and white. For the ones in white, the inventory levels are sufficient to fulfil the order. Each item specifies the quantity required to fulfil the direct order (from the order lines), as well as the quantity needed to produce ordered items.
- The relationships between items and order (in blue and green) give the use of the specific resource or item, as well as the quantities that are used from the inventory. The blue relationships correspond with the order lines, the green ones correspond with the assembly of the ordered items.
Note that in this example, the items that are in inventory are first used to fulfil direct orders. If, after that, there are still items in stock, they are used for product assembly. - The relationships between resources and (sub-) products, in purple, provide information about the number of hours that has to be dedicated to each product,
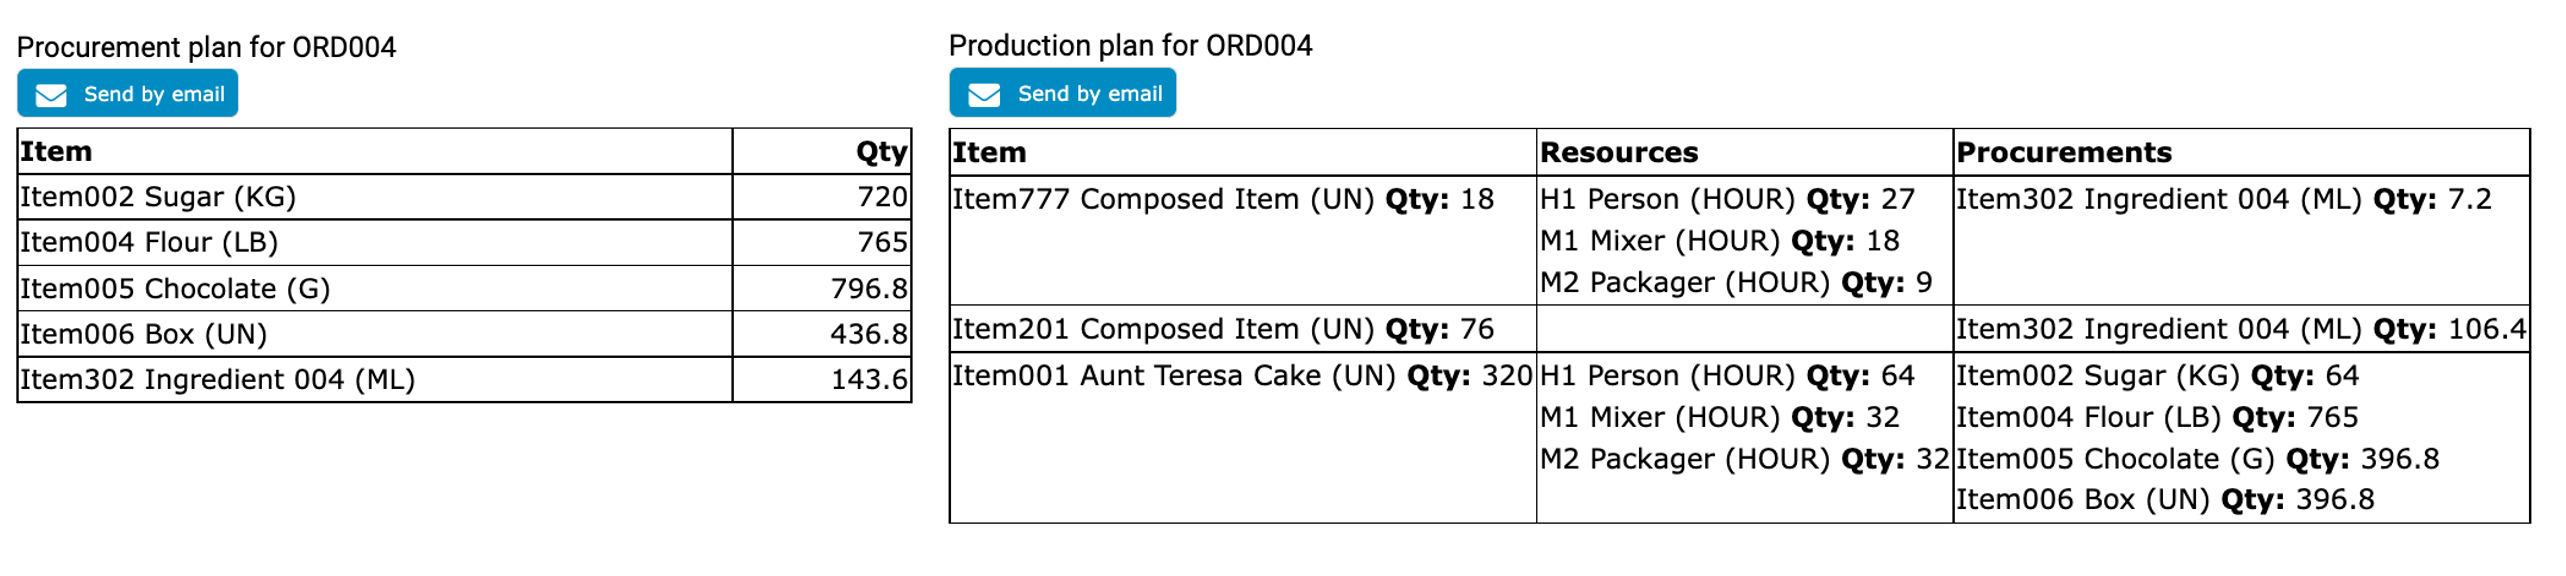
The information in the order fulfilment graph is used to generate a procurement plan (which raw materials should be procured, and in which quantities?), as well as a production plan (which items should be assembled, in which quantity and in which order ?). These plans provide crucial input for the assignment of resources.
The application
The functionality described above is available through a Graphileon dashboard. The dashboard lists the outstanding orders and allows users to visualize the order fulfilment as a graph, and generate the procurement and production plans.
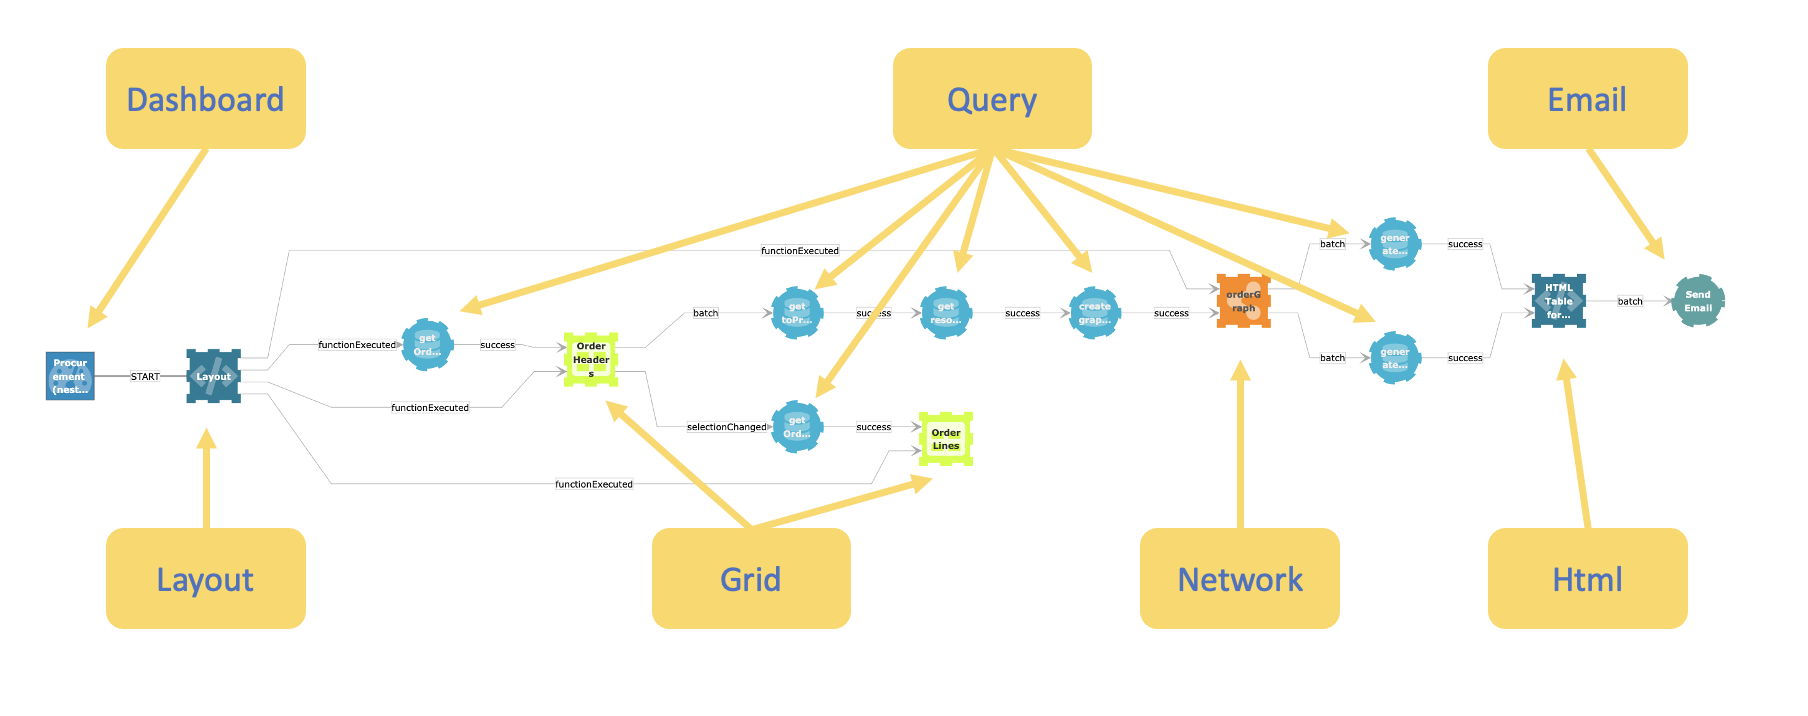
 The user-interface functions (the layout, the grids, the network visualization and others) are interactive and connected to functions behind the scenes, including queries and email functions. All functions are connected by triggers that fire on specific events. As you can see in the picture below, the application itself is a graph too!

 Cloud
Cloud