A while ago, Tom posted a video called Analysis of scenarios in Graphileon. In this video he demonstrates a Graphileon application that takes a network and uses a graph algorithm to find a shortest path between two nodes. While this in itself is not very spectacular -it’s one of the reasons graph databases are used in the first place- the application wraps this basic concept into a nice graphical tool.
As the name of the demo indicates, it is about scenarios. This means that you can run different cases of “what-if” which is achieved by deactivating certain nodes on the existing path and then recalculating the adjusted path.
A characteristic that is not obvious but core to this application is that all scenario adjustments and calculations are done virtually. No data is written to the underlying store when changing the status (start, end, deactivated) of nodes which means that scenario analysis can be done by multiple users simultaneously and without risking changes to the underlying source data.
Requirements
This Graphileon application, as provided here, is quite small and requires only eight additional function nodes. This is what do you need to recreate this application yourself:
- At least Graphileon Personal Edition 2.2.0
- One Neo4j store running from either Neo4jDesktop or Neo4j Server with Neo4j APOC extensions installed
Setting up Graphileon and Neo4j
Preferably, you should install Graphileon on an empty graph store as this prevents you from running into the limit of 64 graphileons that are allowed under the PE license. In case you have already set up Graphileon with an application store, the easiest way to connect to a new store is by creating a new graph store with the same password and port number as the application store that you used with Graphileon previously. If you have problems connecting to the newly created graph store you should check our trouble shooting section and possibly update the config.json file manually.
When setting up your new graph store in Neo4j Desktop (or Server), make sure you also install the APOC extensions.
Adjust and run our script
Download the script for this demo, open it in a text editor and optionally make the following adjustments:
- The script contains a demo network consisting of nodes labelled :DEMO_SCENARIOS:APPLICATION. If you do not want to install these nodes you should remove the part of the script from “// DEMO DATA” to “// END – DEMO DATA” (both marked yellow) onwards.
If you want to use your own network, either label your nodes :Application and link them with relationships of type :NEXT with a weight property. Or adjust the cypher statements in the IA_CypherQuery nodes accordingly. - Check the name of the dashboard to which you want to connect the application. For the default configuration from a new installation of version 2.2.0 or higher this is “Default” and you do not need to alter the script.
You can check the name of your dashboard(s) by running the following query with output set to Grid.
MATCH (n:IA_Dashboard) RETURN n.name
If the name of the dashboard is different from “Default”, you will have to adjust the script accordingly.
Now log in to your Graphileon and copy-paste the entire modified script to the Cypher box and execute. The query will add the nodes and relations for this application to your application store and display them in a NetworkView once finished.
If you want to look under the hood, to see how the demo works, you can always retrieve all relevant functions with the following Cypher statement.
MATCH (n:DEMO_SCENARIO) OPTIONAL MATCH (n)--(m) RETURN n,m
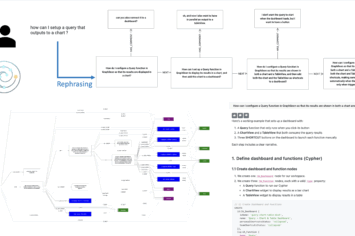
This returns both the function nodes that make the application and the nodes that make up the demo network. You can reorganize the layout of the function nodes and save them as a diagram for later retrieval using the [Save Diagram] button on the NetworkView.
A similar diagram is published here.
Explanation and how to use
Now you only need to reload Graphileon (Ctrl-R) and you’ll see a yellow [Load network] button on the dashboard which opens two network views. One populated with the demo network, and one empty to contain the calculated path.
Select start and end nodes
Select your start node and end node in the Scenario view by right clicking the node and selecting ‘Switch to start’ and ‘Switch to end’ respectively. These two nodes will change shape, color and label as soon as they are updated. Before selecting different Start or End nodes you have to switch the current ones off first.
Running the algorithms
You can now run one the Shortest Path algorithm from the button bar at the top of the Scenario view.
The calculated path will be painted in the Scenario view by a blue line and the nodes on the path will be displayed in the 2nd view. The caption of that second view will also display information on the path length.
Disabling nodes
You can now try what happens if you disable one or more nodes on the calculated path, or elsewhere in the network. This is done from the node context menu option ‘Switch active’. As soon as the node status is toggled it turns red and the new alternative path is displayed. No path is drawn if no solution is found.
Graphileon function usage
This demo uses only two types of Graphileon functions:
- IA_NetworkView: Two NetworkViews are used to display the demo network and the path found
- IA_CypherQuery: Six queries are used to retrieve the network, toggle the status of nodes and process data for display in the NetworkViews
Some final notes
Styling of nodes and calculated path
Styles for this demo are stored in a UserStyles node, linked to the Scenario NetworkView. The :USES link between the two nodes is purely symbolic and only there to keep them together as the use of the styles by the NetworkView is encoded in its styles property which contains the id of the UserStyles node.
The relevant styles are :Application, :Application[start=1], :Application[end=1] and :Application[active=0] for application nodes, start nodes, end nodes and deactivated nodes respectively. The calculated paths are marked by style :NEXT[onpath=1]
If you want to apply your own custom styles you best do so in the regular styling dialog. To disable the styles included in the script you should remove the styles key from the Scenario NetworkView.
NetworkView functionality
The Scenarios NetworkView has limited functionality in terms of editing nodes. If you want to modify the network structure, you have to do so from the main NetworkView.
.. and now it is up to you!
This instruction should allow you to install this demo on your installation and get you up and running with the Analysis of scenarios demo.
Feel free to run it on your own network data, build in your own graph algorithms, modify styles and adjust it to your liking. We hope this example provides you with a lot of inspiration for building your own graphy applications in Graphileon!


 Cloud
Cloud