The publication of the Panama Papers, based on leaked financial documents that were analyzed by the International Consortium of Investigative Journalists (ICIJ) has not only generated a lot of interest and comments with regard to the pros and cons of offshore tax structures used by the world’s elites, it also sparked interest in the tools that were used to carry out this research. Tools that included Apache Solr, Tika, Linkurious and Neo4j .
Finding interesting cases or sub-networks in the mutually heavily connected 11.5 million content items, is a challenge in itself. That is why the ICIJ is making the Neo4j dataset publicly available, and invited the community to go and dig. Combining efforts should yield a better result.
Ok. But … how do you combine the results of individual research efforts? How do you share parts of a network that you have been doing research on? How do you know whether someone else has already dug into the case that you are looking into? Or who has found cases that partially overlap with yours?
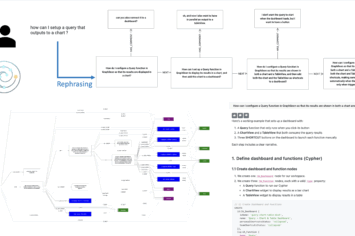
To find the answers to these questions, we played around with Graphileon to create a dashboard that allows users to:
- Get and idea of what is in the graph store
- Start exploring various ways (full text, following a path, controlled exploration)
- Save a “case” as a diagram
- Access diagrams of others
- Find overlapping cases
- Trace back (how did you get here?)
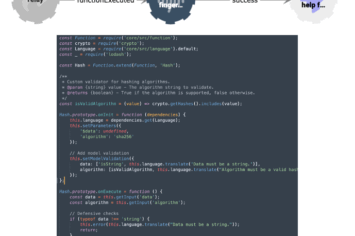
The video below illustrates the functionality that we configured. Yes .. configured. Not coded. All panels (tables, networks, diagrams) and queries are so-called Graphileon functions, linked to each other by triggers that carry data and parameters. After all, the dashboard is a graph too. And all you need to build dashboards like this, is knowledge of Neo4j’s Cypher language.
InterActor can also be used to visualise how investigative paths of journalists converge or diverge, using the same non-coding approach, with a concept we call pathdistances.

 Cloud
Cloud