With Graphileon you can run your own queries from the Query box on the left. Every query you run is stored in the Recent queries list so you can rerun it or reload and modify it. However, if you find yourself running the same query regularly then you might want to extend your dashboard with a button for that query so executing it becomes a one-click action. In the following example we explain how to do that for a query displaying tabulated results and one displaying a network.
We want to add two buttons on the user panel that, when clicked, display tabulated and network results respectively.
Note that for this demo we have not set up an additional data store so we are just querying the data from the Application Store that is linked anyway.
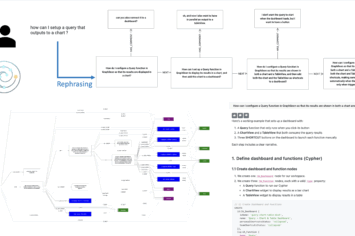
This mini app is built in Graphileon and has a graph structure itself
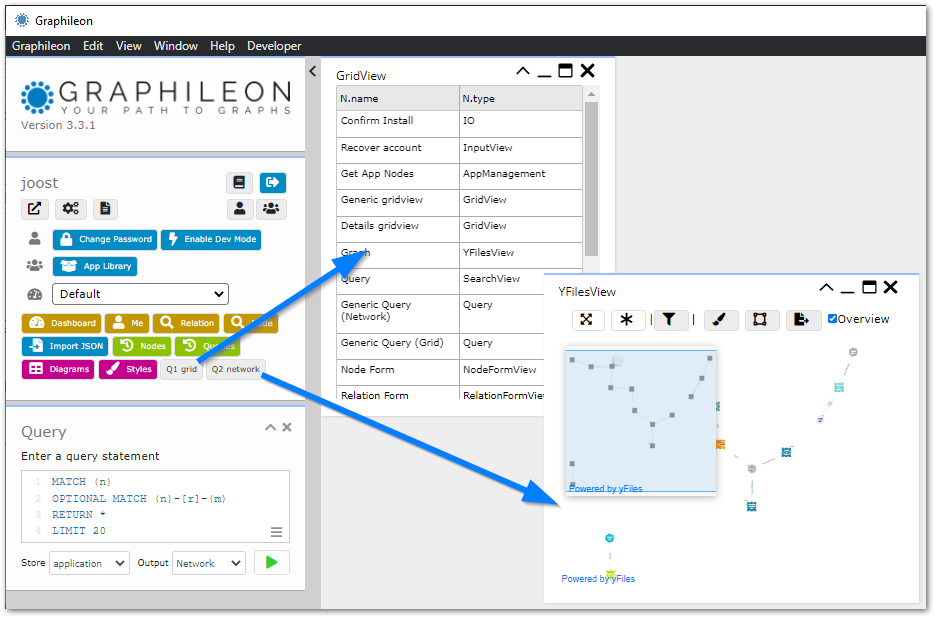
Query showing a table
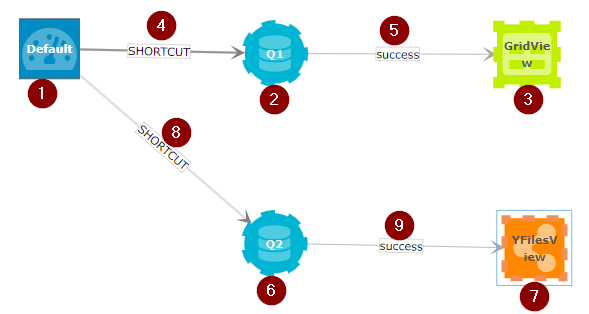
To get buttons on the user panel we have to create SHORTCUT relations from the node representing the dashboard to another function. Since we want to execute queries we have to create a SHORTCUT relationship between the Dashboard node and the Query node.
- First get the node representing the default dashboard by clicking the dashboard button . This will put node (1) in the center of an empty networkview.
In order to create a relationship we have to create a second node to represent the query function.
- Right click somewhere in the network and select “Create node at this location”. This opens an empty NodeForm for function node (2).
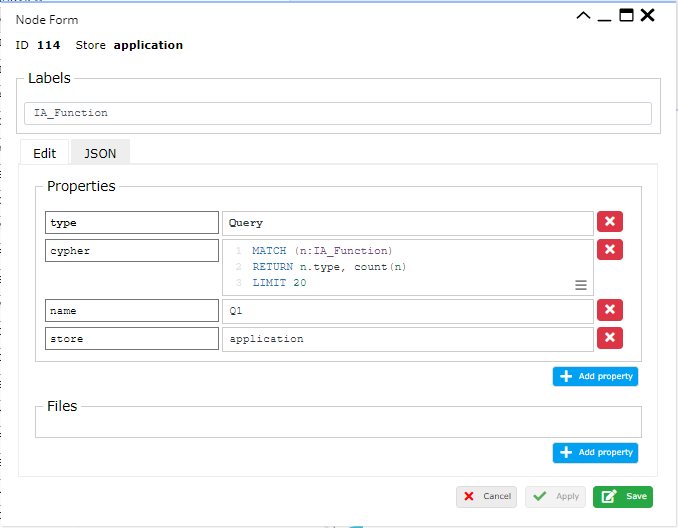
- For Labels enter IA_Function and make sure the store reads ‘application’. The node id will be assigned once saved. Then add properties.
- Add a property ‘type’ and set its value to ‘Query’. This defines the function as a query.
- Next, add a property ‘cypher’ (assuming you run a Cypher language store, otherwise use ‘gremlin’ or ‘sparql’) and enter a query of your choice.
Test the query first in the Query box on the left so you know it does not contain errors (this example uses a query that counts the different function types in the application store).
Note that we want to use Q1 to display tabular results so make sure your query has result fields. - Give the query a name, this is mainly for easy recognition/explanation
- Add a property ‘store’ and set its value to the name of the store that you want to query. The default (when not explicitly defined) is ‘application’ but if you added a second store to the Graphileon configuration for your business data and named that store -‘mydata’ for example- then the value of ‘store’ should be set to ‘mydata’.
Now save this function node. You can edit it anytime by right-clicking and selecting ‘Edit’.
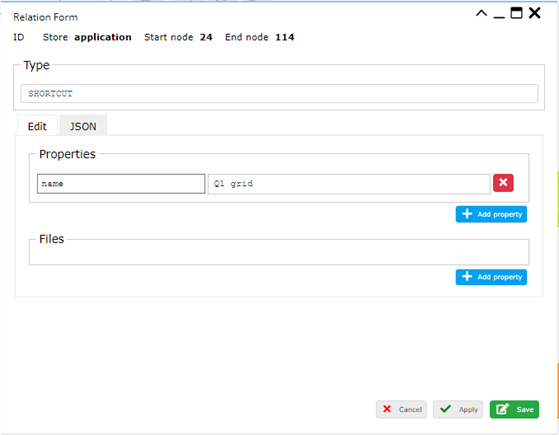
To run the query and give it a button on the user panel we have to connect Dashboard and Query node with a special relationship of type SHORTCUT.
- Create the SHORTCUT relationship (4) by holding the Ctrl or Cmd button on your keyboard while dragging from the center of the dashboard node to the center of the query node and then release. This opens the Relation Form.
Here, for Type, you enter ‘SHORTCUT’. Then add one property called ‘name’ and for value type the text you want to appear on the button (here ‘Q1 grid’). The button will appear on the user panel only after refreshing/reloading the page.
If you want to influence the order of the buttons on the user panel the add a property ‘index’ and give it a value depending on the values of the other shortcuts from the dashboard (100 is a good value to start with)
However, just starting the query is not enough to display its results.
- To do this we add another Function node of type ‘GridView’ which we give two properties ‘container.height’, set to 800, and ‘container.width ’ set to 600. Then save the GridView node (3)
Now we still need to send the results from the Query node to the GridView node.
- To do this we create a relationship (5) from the Query node to the GridView. The Type of this relationship is ‘TRIGGER’ which means it is triggered by the Query. We add a property ‘type’ with value ‘success’ which indicates that the Trigger is only processed when the Query executes successfully.
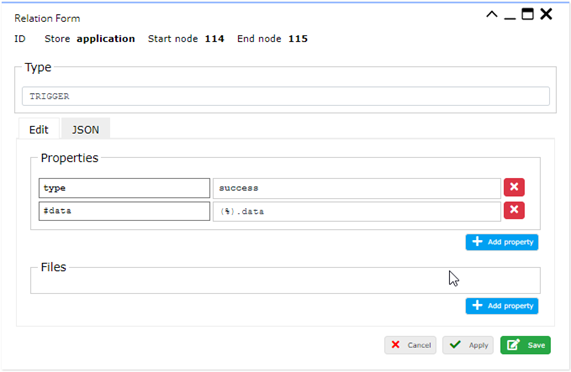
- We add one more property ‘#data’ and set its value to ‘(%).data’ which means that we set the GridView data array (#data) to the data object as present on the Trigger ( where ‘(%)’ represents the Trigger object, ‘(%).data’, its data object ). Now save this relationship and we are ready to try it out.
But before we do, it is good practice to save the configuration you just built as a diagram so it can be easily retrieved later.
- To do so, use the pink [Save diagram] button at the top of the networkview and give your diagram a name.
Now you can reload Graphileon (F5 in browser or menu | Window | Reload in standalone version). After a reload the ‘Q1 grid’ button should be visible and clicking it should give you the table as in figure 1.
Query displaying a network
Now let’s expand the configuration by adding a query that loads into a NetworkView.
- First we reload the diagram we just created so we can continue from there. Click the pink [Diagrams] button on the user panel to show the list of saved diagrams and click the one you created to reload the configuration.
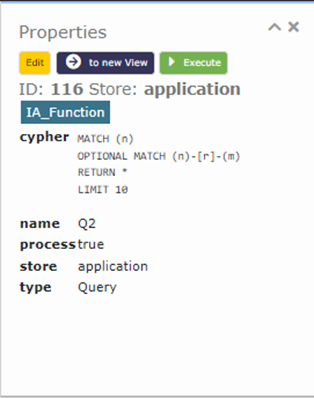
- Create a second Query function node (6) , name it Q2 and add a query that displays a graph. Make sure your query does return nodes (and relations) as a network view (NetworkView or YFilesView) cannot display tabulated results. Since we want to display the results in a network we need to add one more property ‘process’ with value ‘true’. This takes care of preparing the query results for display in a network.
- Connect the Dashboard to Q2 with a SHORTCUT relationship (8).
- Now create a new IA_Function node and add a property ‘type’ with value ‘YFilesView’ (7).
- Connect the Query node to the YFilesView node with a relationship of type TRIGGER (9).
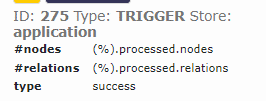
- Add a property ‘type’ with value ‘success’ so the network is only shown when the query was successful.
- The YFilesView component has ‘#nodes’ and ‘#relations’ objects which are set to the ‘(%).processed.nodes’ and ‘(%).processed.relations’ values from the trigger.
Save the trigger and the updates to the diagram and refresh the page. You should now have a second button that, when clicked, shows you data in a graph as in figure 1.
That’s it! When you follow the above steps you should have the mini application as described above.
If you just want to get the code running then you can download the json for the above example here. Copy the code, click the blue [Import JSON] button on the Graphileon user panel and past it there. Leave ‘Create App’ unchecked and keep ‘application’ for store. After a reload of Graphileon you should have the two new buttons on your user panel. Note that the diagram for the application structure is not automatically created.
The above example is very simple and can easily be expanded, for example by parametrizing the queries or by having the table and network respond to user input.

 Cloud
Cloud