Following our article on topic extraction with MeaningCloud and Graphileon we had some users asking for instructions on how to build that application themselves.
In this article we’ll describe the 2nd demo from that blog post, a Graphileon application which allows you add ‘Documents’ -pieces of text on a particular topic- which are then processed by MeaningCloud, recreated as a graph by Graphileon, and correlated to other documents that share vectors with the source article.
This application itself is quite small -16 additional function nodes in total only- so it fits exactly within the limit of 64 graphileons allowed by our Personal Edition version 2.2.0.
Requirements
This is what do you need to recreate this application yourself:
- Graphileon Personal Edition 2.2.0
- One Neo4j store running from either Neo4jDesktop or Neo4j Server with
- the Neo4j APOC extensions
- the Neo4j Graph Algorithms library
- A free account with MeaningCloud and an API key
Setting up Neo4j
Preferably, you should install Graphileon on an empty graph store as this prevents you from running into the limit of 64 graphileons that are allowed under the PE license. In case you have already set up Graphileon with an application store, the easiest way to connect to a new store is by creating a new graph store with the same password and port number as the application store that you used with Graphileon previously. If you have problems connecting to the newly created graph store you should check our trouble shooting section and possibly update the config.json file manually.
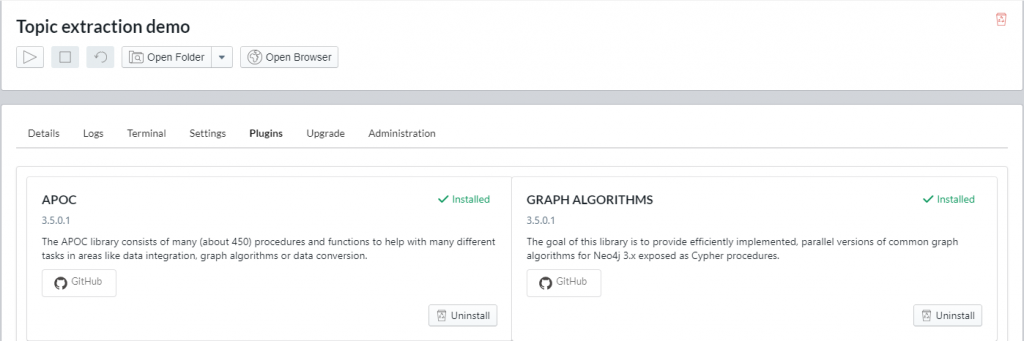
When setting up your new graph store in Neo4j Desktop (or Server), make sure you also install the APOC extensions and Graph Algorithms library as in the image below.
Registering with MeaningCloud
Visit the MeaningCloud website, register for a free account and obtain your API key.
Adjust and run our script
Download the script for this demo and open it in a text editor to make the following adjustments:
- Replace the text MEANINGCLOUDAPIKEY by the actual key you obtained.
- Check the name of the dashboard to which you want to connect the application. For the default configuration from a new installation of version 2.2.0 or higher this is “Default” and you do not need to alter the script.
You can check the name of your dashboard(s) by running the following query with output set to Grid.
MATCH (n:IA_Dashboard) RETURN n.name
If the name of the dashboard is different from “Default”, you will have to adjust the script accordingly.
Now log in to your Graphileon PE and copy-paste the entire modified script to the Cypher box and execute. The query will add the nodes and relations for this demo application to your application store and displays them in a NetworkView once finished.
If you want to look under the hood, to see how the demo works, you can retrieve all relevant functions with the following Cypher statement.
MATCH (n:DEMO_MC1) OPTIONAL MATCH (n)--(m) RETURN n,m
You can reorganize the layout of these nodes and save them as a diagram for later retrieval using the [Save Diagram] button on the NetworkView. This is similar to the diagram published with the original post although you will have to reorganize the layout accordingly.
Now you only need to reload Graphileon (Ctrl-R) and you’ll see a button on the dashboard plus a popup window named Documents.
Explanation and how to use
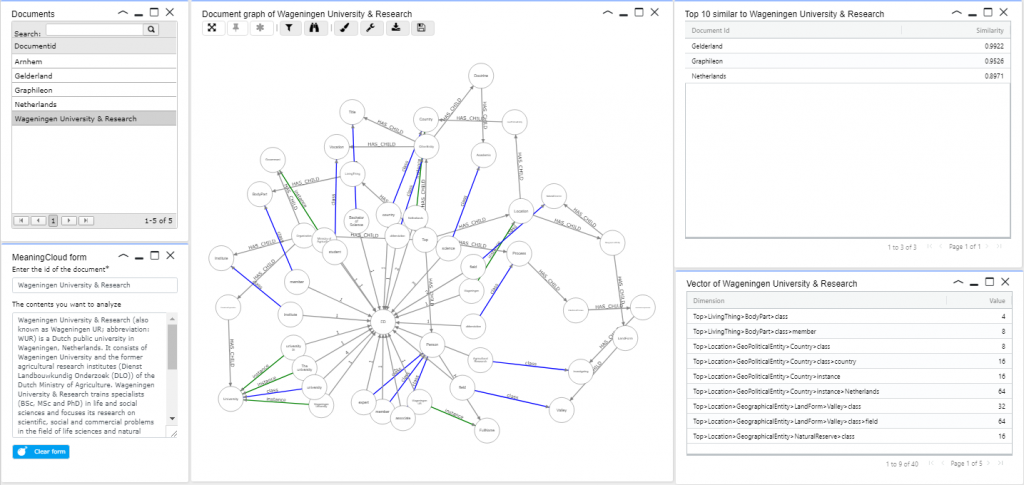
The application consists of 5 “views”
- Documents: the list that is started with the dashboard and from which you can select an existing document for editing or delete a document.
- MeaningCloud form: a data-entry form.
- Document graph: this shows the network for the selected document.
- Vector list: showing the dimensions/vectors for the selected document.
- Similarity list: showing the 10 most similar documents, based on cosine similarity.
The list of Documents appears immediately after the dashboard has loaded and the MeaningCloud form can be displayed using the button on the dashboard. Other views can be displayed from either the context menu of the document list or will popup once you start adding documents from the MeaningCloud form.
Using the application:
- Click on the [MeaningCloud form] button to add new documents.
- Enter an id (short title) for the document.
- Now paste or enter text for your document in the contents box.
The contents box is scanned every 10 seconds and passed to the MeaningCloud service for processing. The returned terms and topics are inserted into your graph on the fly.
When the text is adjusted or removed the graph is modified accordingly.
The [Clear form] button resets the title and contents so you can start a new document.
The list of documents implements three context menu options on right-click of a row in the list:
- show graph & vector and similar
- show document node and links
- delete document
Graphileon function usage
This demo uses the following Graphileon functions:
- IA_FormView: to configure and display a form for data entry, based on https://jsonforms.io/
- IA_Timer: to scan the content of the MeaningCloud form at 10 second intervals and pass the contents on for analysis
- IA_Request: the function that connects to the MeaningCloud service, passes the content text and receives the processed entities and concepts
- IA_CypherQuery: Nine queries process data for display in Network and TableViews
- IA_TableVIew: A simple table to display the list of documents
- IA_AgGridView: A more advanced table view based on the powerful ag-Grid framework
And that’s it!
This instruction should get you up and running with the Topic Extraction demo and hopefully provide you with a lot of inspiration for building your own graphy applications in Graphileon!
 Cloud
Cloud